
Sources of environment pollution in a city - Graph, Chart, Map, Diagram and Table Interpretation for HSC & SSC / The chart shows the sources of environment pollution in a city
- Fakhruddin Babar

- 3 days ago
- 4 min read
DinajPur-2019
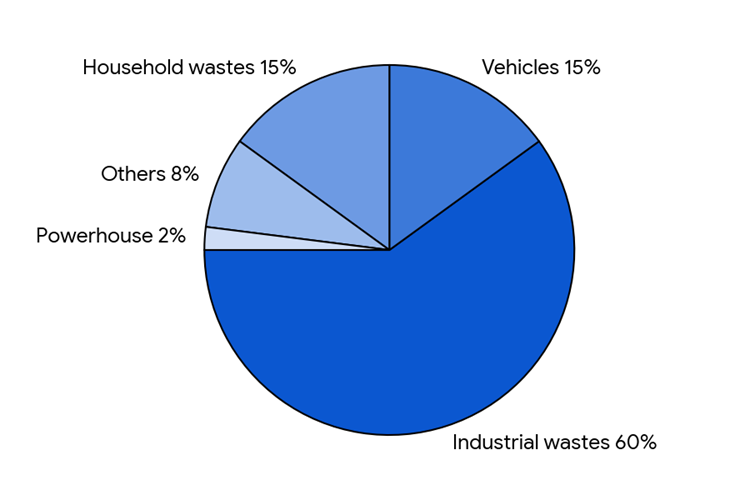
Look at the chart below. It shows the sources of environment pollution in a city. Now, analyse the chart in at least 80 words. You should highlight the information and the main features given in the chart. 10
Sample Answer 1
The pie chart shows the different causes of environmental pollution in a city. It gives the percentages for five different sources. Overall, it is very clear that industrial waste is the biggest reason for pollution. On the other hand, powerhouses cause the least amount of pollution.
Looking closely at the chart, industrial waste creates the most problems for the city's environment. It is responsible for a massive 60% of all the pollution. This is much more than half of the whole chart. The next two causes of pollution are vehicles and household wastes. Interestingly, they both produce the exact same amount of pollution. Vehicles cause 15% of the damage, and daily household waste also causes exactly 15%. If we add these two together, they make up 30% of the total pollution.
Moving to the smaller parts of the pie chart, we can see two other sources. There are some other mixed reasons that are not specifically named, and they cause exactly 8% of the pollution. Finally, powerhouses are at the absolute bottom. They create only 2%.
Sample Answer 2
The provided pie chart delineates the primary contributors to environmental degradation within a specific urban area, presenting the proportional impact of five distinct pollution sources. An overarching analysis reveals that industrial emissions and byproducts overwhelmingly dominate the pollution landscape. In stark contrast, energy generation facilities constitute a highly negligible fraction of the city's overall environmental contamination.
Delving into the specific empirical data, the industrial sector stands as the most severe environmental hazard, accounting for a staggering 60% of the total pollution. This single category effectively dwarfs all other sources combined. Trailing significantly behind are vehicular emissions and domestic refuse. Notably, these two distinct categories exhibit identical statistical values, each capturing exactly 15% of the pollution distribution. Cumulatively, transportation and household wastes are responsible for nearly a third of the environmental damage.
Shifting focus to the least detrimental contributors, a miscellaneous category designated as 'others' represents a modest 8% of the total pollution output. Finally, at the absolute nadir of the spectrum, local powerhouses generate a mere 2% of the contamination, underscoring their minimal environmental footprint in this metropolis.
Sample Answer 3
The pie chart offers a comprehensive proportional breakdown of the various sources responsible for environmental pollution in a metropolitan area. From a holistic perspective, it is unequivocally clear that the city’s ecological degradation is primarily driven by industrial activities. Conversely, the environmental impact stemming from local power generation is surprisingly minimal.
Focusing on the preeminent figures, industrial wastes represent the absolute pinnacle of the pollution crisis, securing an overwhelming 60% share of the chart. This indicates that industrial output alone is responsible for more contamination than the remaining four categories combined. The secondary sources of pollution are divided equally between the transportation sector and residential garbage. Vehicles contribute exactly 15% to the environmental decline, perfectly mirroring the proportion of pollution generated by everyday household wastes.
Turning attention to the minor contributors, an amalgamation of unspecified sources, categorized simply as 'others', accounts for a marginal 8% of the total ecological damage. Lastly, the powerhouse sector exhibits the lowest metric on the entire chart. It is responsible for a negligible 2% of the urban pollution, rendering it the least harmful entity.
Vocabulary List (A-Z)
Absolute - পরম / সম্পূর্ণ
Amalgamation - সংমিশ্রণ / একত্রীকরণ
Breakdown - বিভাজন / বিশ্লেষণ
Comprehensive - ব্যাপক / বিস্তৃত
Contamination - দূষণ
Conversely - বিপরীতক্রমে / অন্যদিকে
Cumulatively - ক্রমবর্ধমানভাবে / সমষ্টিগতভাবে
Degradation - অবনতি / অবক্ষয়
Delineates - বর্ণনা করা / চিত্রিত করা
Detrimental - ক্ষতিকর / হানিকর
Domestic - গার্হস্থ্য / গৃহস্থালি সম্বন্ধীয়
Dominate - আধিপত্য বিস্তার করা
Dwarfs - ক্ষুদ্র প্রমাণ করা / ম্লান করে দেওয়া
Ecological - পরিবেশগত / বাস্তুতন্ত্র সম্বন্ধীয়
Emissions - নির্গমন (গ্যাস বা ধোঁয়ার)
Empirical - বাস্তব অভিজ্ঞতাভিত্তিক / প্রায়োগিক
Entity - সত্তা / অস্তিত্ব
Environmental - পরিবেশগত
Footprint - পদচিহ্ন / প্রভাবের পরিধি
Generation - উৎপাদন / সৃষ্টি
Hazard - ঝুঁকি / বিপদ
Holistic - সামগ্রিক / পূর্ণাঙ্গ
Identical - হুবহু এক / অভিন্ন
Industrial - শিল্পবিষয়ক
Marginal - প্রান্তিক / সামান্য
Metropolitan - মহানগর সম্বন্ধীয়
Miscellaneous - বিবিধ / নানা প্রকার
Modest - পরিমিত / সামান্য
Nadir - সর্বনিম্ন বিন্দু / তলানি
Negligible - নগণ্য / উপেক্ষণীয়
Output - উৎপাদন / ফলাফল
Overarching - সামগ্রিক / সর্বব্যাপী
Overwhelming - অপ্রতিরোধ্য / বিপুল
Perspective - দৃষ্টিকোণ / দৃষ্টিভঙ্গি
Pinnacle - চূড়া / শীর্ষবিন্দু
Preeminent - শ্রেষ্ঠ / সর্বপ্রধান
Proportional - আনুপাতিক
Refuse (noun) - আবর্জনা / বর্জ্য
Rendering - পরিণত করা / প্রদান করা
Residential - আবাসিক
Sector - খাত / বিভাগ
Spectrum - বর্ণালী / পরিসর
Staggering - বিস্ময়কর / হতবাক করার মতো
Stark - সম্পূর্ণ / প্রকট (পার্থক্য বোঝাতে)
Stemming - উদ্ভূত / উৎপন্ন হওয়া
Trailing - পিছিয়ে পড়া / অনুসরণ করা
Unequivocally - দ্ব্যর্থহীনভাবে / স্পষ্টভাবে
Unspecified - অনির্ধারিত / নির্দিষ্ট করে বলা হয়নি এমন
Urban - শহর সম্বন্ধীয় / নাগরিক
Vehicular - যানবাহন সম্বন্ধীয়


Comments